Outputs
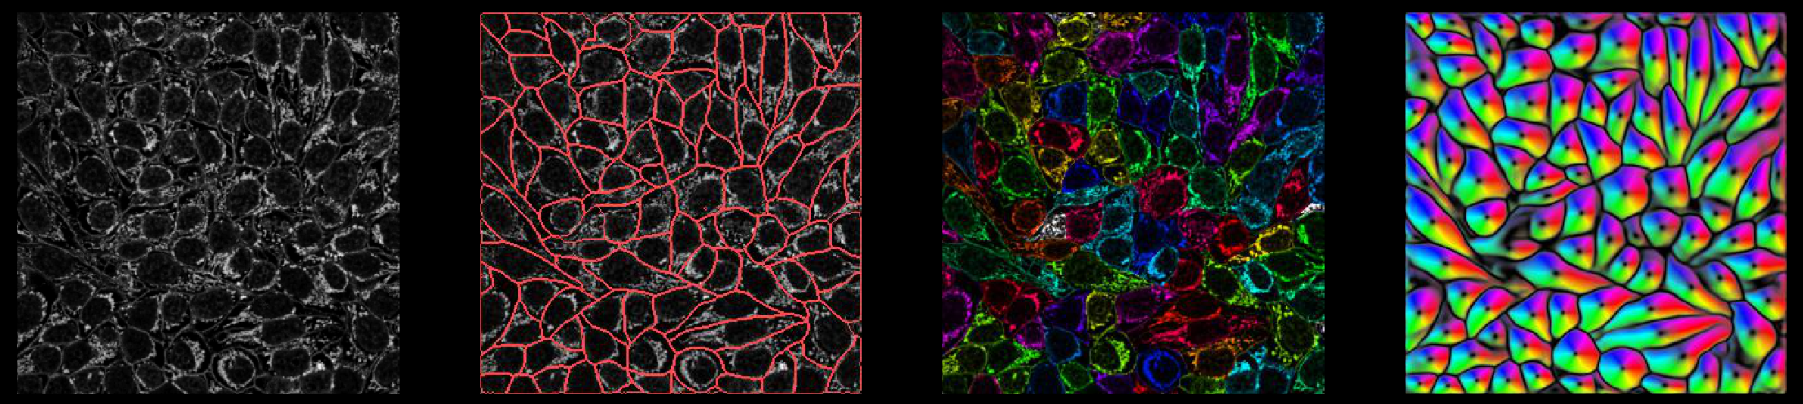
Omnipose uses a generalized version of the Cellpose U-net to predict several output "images" based on an input image.
You can use a Cellpose model with Omnipose (omni=True), which just turns on the Omnipose mask reconstruction algorithm to fix the over-segmentation errors that may result form your Cellpose network outputs.
Cellpose models predict 2 outputs: flows and cell probability (cellprob). The predictions the network makes of cellprob are the inputs to a sigmoid centered at zero (\(\sigma(x) = \frac{1}{1 + e^{-x}}\)), so they vary from around \(-6\) to \(+6\). The flow field is a vector field and is therefore comprised of \(N\) distinct outputs in \(N\) dimensions.
The original Omnipose models predict 3 outputs: distance field, flow field, and boundary. The distance field is modified during training to have a background of \(-5\) instead of \(0\). This helps balance the asymmetry in output range, as the flow components range from \(-5\) to \(-5\) and the boundary field ranges from roughly \(-6\) to \(+6\). (same sigmoid input described above).
New Omnipose models no longer require the boundary field to achieve the same accuracy, and thus by default train with just distance and flow (nclasses=2).
Warning
If you trained a custom model with Omnipose <= version 0.4.0, your defaults were nclasses=3 and nchan=2. Use these settings when initializing you model. Moving forward, Omnipose will use nclasses=2 and nchan=1 by default. See Pretrained models for a table of models and the number of outputs.
_seg.npy output
*_seg.npy files have the following fields:
filename : filename of image
img : image with chosen channels (CYX) (if not multiplane)
masks : masks (0 = NO masks; 1,2,... = mask labels)
colors : colors for masks
outlines : outlines of masks (0 = NO outline; 1,2,... = outline labels)
chan_choose : channels that you chose in GUI (0=gray/none, 1=red, 2=green, 3=blue)
ismanual : element k = whether or not mask k was manually drawn or computed by Omnipose/Cellpose
- flowsflows[0] is XY flow in RGB, flows[1] is the cell probability in range 0-255 instead of 0.0 to 1.0, flows[2] is Z flow in range 0-255 (if it exists, otherwise zeros),
flows[3] is [dY, dX, cellprob] (or [dZ, dY, dX, cellprob] for 3D), flows[4] is pixel destinations (for internal use)
est_diam : estimated diameter (if run on command line)
zdraw : for each mask, which planes were manually labelled (planes in between manually drawn have interpolated masks)
Here is an example of loading in a *_seg.npy file and plotting masks and outlines
import numpy as np
from cellpose_omni import plot
dat = np.load('_seg.npy', allow_pickle=True).item()

# plot image with masks overlaid
mask_RGB = plot.mask_overlay(dat['img'], dat['masks'],
                        colors=np.array(dat['colors']))

# plot image with outlines overlaid in red
outlines = plot.outlines_list(dat['masks'])
plt.imshow(dat['img'])
for o in outlines:
    plt.plot(o[:,0], o[:,1], color='r')
If you run in a notebook and want to save to a *_seg.npy file, run
from cellpose_omni import io
io.masks_flows_to_seg(images, masks, flows, diams, file_name, channels)
where each of these inputs is a list (as is the output of model.eval)
PNG output
You can save masks to PNG in the GUI. Be aware that the GUI will save the masks in the format being displayed,
which defaults to the N-color representation for easier visualization and editing (4 or 5 repeating colors). Toggle off ncolor before
saving masks to put them in standard 1,...,N format.
To save masks (and other plots in PNG) using the command line, add the flag --save_png. If you want the N-color versions saved, use --save_ncolor.
In a notebook, use:
from cellpose_omni import io
io.save_to_png(images, masks, flows, image_names)
ROI manager compatible output for ImageJ
You can save the outlines of masks in a text file that is compatible with ImageJ ROI Manager from the GUI File menu.
To save using the command line, add the flag --save_txt.
Use the function below if running in a notebook:
from cellpose_omni import io, plot

# image_name is file name of image
# masks is numpy array of masks for image
base = os.path.splitext(image_name)[0]
outlines = utils.outlines_list(masks)
io.outlines_to_text(base, outlines)
To load this _cp_outlines.txt file into ImageJ, use the python script
provided in Cellpose: imagej_roi_converter.py. Run this as a macro after
opening your image file. It will ask you to input the path to the _cp_outlines.txt
file. Input that and the ROIs will appear in the ROI manager.
Plotting functions
In plot.py there are functions, like show_segmentation:
from cellpose_omni import plot

nimg = len(imgs)
for idx in range(nimg):
    maski = masks[idx]
    flowi = flows[idx][0]

    fig = plt.figure(figsize=(12,5))
    plot.show_segmentation(fig, imgs[idx], maski, flowi, channels=channels[idx])
    plt.tight_layout()
    plt.show()