Logo
This is a little cute: Omnipose can "segment" text using the bact_phase_omni model. Semantic segmentation of uniform,
disjoint shapes on a uniform background is absolutely no feat, but it is amusing that a neural network trained purely on
phase contrast images of bacteria gives such reasonable output on something so different from the training set.
Also, the over-segmentation at cusps hints that the network has learned to pick up on local morphology.
To make the Omnipose logo/title/favicon, I first generate some rasterized text images with roughly the same mean diameter as the bacteria in my training set:
Show code cell source
 1# Make some text images
 2
 3from PIL import Image, ImageDraw, ImageFont
 4import numpy as np
 5import matplotlib.pyplot as plt
 6plt.style.use('dark_background')
 7import matplotlib as mpl
 8%matplotlib inline
 9mpl.rcParams['figure.dpi'] = 300
10
11from omnipose.measure import bbox_to_slice
12
13tsizes = [60]
14texts = ["Omnipose","O"]
15imgs = []
16for textsize in tsizes:
17    fonts = [ImageFont.truetype(f, textsize) for f in ["SFNSRounded.ttf"]]
18    # fonts = [ImageFont.truetype(f, textsize) for f in ["Arial.ttf"]]
19    for text in texts:
20        for font in fonts:
21            size = np.array([textsize*len(text)*2, textsize*2])
22            im = Image.new("RGB", tuple(size), "white")
23            d = ImageDraw.Draw(im)
24            center = size/2
25            anchor = "mm"
26            d.text(center, text, fill="black", anchor=anchor, font=font)
27            bbox = d.textbbox(center, text, anchor=anchor, font=font)
28            bbox = [bbox[1],bbox[0],bbox[3],bbox[2]] # reverse x, y
29            im = np.array(im)
30            shape = im.shape[:2]
31            slc = bbox_to_slice(bbox,shape,pad = 3)
32            im = im[slc]
33            imgs.append(im)
34
35
36            fig = plt.figure(figsize=(1,1))
37            fig.patch.set_facecolor([0]*4)
38
39
40            plt.imshow(im)
41            plt.axis('off')
42            plt.show()

Segmentation
I will then segment these image with the standard settings:
Show code cell source
 1%%capture --no-display
 2from cellpose_omni import plot, models, core
 3import omnipose
 4
 5model_name = 'bact_phase_omni'
 6use_GPU = core.use_gpu()
 7model = models.CellposeModel(gpu=use_GPU, model_type=model_name)
 8
 9
10chans = [0,0] #this means segment based on first channel, no second channel
11nimg = len(imgs)
12n = range(nimg)
13
14# define parameters
15mask_threshold = 1
16verbose = 0
17use_gpu = use_GPU
18transparency = True
19rescale=None
20omni = True
21flow_threshold = 0
22resample = True
23cluster = False
24
25masks, flows, styles = model.eval([imgs[i][...,-1] for i in n],
26                                  channels=chans,
27                                  rescale=rescale,
28                                  mask_threshold=mask_threshold,
29                                  transparency=transparency,
30                                  flow_threshold=flow_threshold,
31                                  omni=omni,resample=resample,
32                                  verbose=verbose,
33                                  cluster=cluster)
34
35
36mpl.rcParams['figure.dpi'] = 300
37plt.style.use('dark_background')
38
39for idx,i in enumerate(n):
40
41    maski = masks[idx] # get masks
42    bdi = flows[idx][-1] # get boundaries
43    flowi = flows[idx][0] # get RGB flows
44
45    # set up the output figure to better match the resolution of the images
46    # f = 10
47    # szX = maski.shape[-1]/mpl.rcParams['figure.dpi']*f
48    # szY = maski.shape[-2]/mpl.rcParams['figure.dpi']*f
49    szX,szY = 10,10
50    fig = plt.figure(figsize=(szY,szX*4))
51    fig.patch.set_facecolor([0]*4)
52
53    plot.show_segmentation(fig, omnipose.utils.normalize99(imgs[i]),
54                           maski, flowi, bdi, channels=chans, omni=True, interpolation=None)
55
56    plt.tight_layout()
57    plt.show()
2025-06-28 01:35:10,274	[INFO]     cellpose_omni/models.py                   	 line 436	>>bact_phase_omni<< model set to be used
2025-06-28 01:35:10,276	[INFO]     cellpose_omni/core.py         assi...evice()	 line  67	Using GPU.
2025-06-28 01:35:10,540	[INFO]                                   __init__....()	 line 173	u-net config: ([2, 32, 64, 128, 256], 4, 2)


I landed on this font because it is one of Apple's system defaults (and therefore works well with the system fonts used on our website when viewed on Apple devices), and I chose this scale because it is very close to bacteria and showed a good amount of 'segmentation' in the M, N, P, and E from purely local morphology (cusps). This gives reasonable output at higher-resolution text (wider 'cells'), but it starts to hallucinate output between objects if the size gets too large.
Adjusting transparency
The transparency (alpha channel) is set by the flow magnitude, and the color (RGB channels) is set by the flow angle according to a shifted sinebow relation:
angles = np.arctan2(dP[1], dP[0])+np.pi
r = ((np.cos(angles)+1)/2)
g = ((np.cos(angles+2*np.pi/3)+1)/2)
b =((np.cos(angles+4*np.pi/3)+1)/2)
(a is just a constant, not alpha). The slight tinge of green comes from the fact that np.arctan2(0,0)=0 and ((np.cos(0+2*np.pi/3)+1)/2) = 1/4. I'll try two ways to remove it:
first by removing any average background bias, second by adjusting the alpha channel so that the background alpha is 0 on average.
Show code cell source
 1import skimage.io
 2import os
 3from omnipose.utils import normalize99, rescale
 4from scipy.ndimage import zoom
 5from pathlib import Path
 6
 7omnidir = Path(omnipose.__file__).parent.parent.parent
 8basedir = os.path.join(omnidir,'docs','_static')
 9names = ['logo.png','icon.ico']
10ext = '.png'
11
12for idx,i in enumerate(n):
13
14    maski = masks[idx]
15    flowi = flows[idx][0]
16    dPi = flows[idx][1]
17    bias = [np.mean(d[maski==0]) for d in dPi]
18    angle = np.arctan2(bias[1], bias[0]) / np.pi
19    print('avarage bias is {}, average angle is {} pi rad.'.format(bias,angle))
20    dPi_new = np.stack([np.clip(d - b,-np.inf,np.inf) for d,b in zip(dPi,bias)])
21    flowi_new = plot.dx_to_circ(dPi_new,transparency=True)
22
23    flowi_3 = flowi.copy()
24    alpha = flowi_3[...,-1]
25    flowi_3[...,-1] = rescale(np.clip(alpha-np.mean(alpha[maski==0]),0,np.inf))*255
26
27    f = 30
28    szX = maski.shape[-1]/mpl.rcParams['figure.dpi']*f
29    szY = maski.shape[-2]/mpl.rcParams['figure.dpi']*f
30    fig = plt.figure(figsize=(szY,szX*4))
31    fig.patch.set_facecolor([0]*4)
32
33    plt.imshow(np.hstack([flowi,flowi_new,flowi_3]))
34    plt.axis('off')
35    plt.show()
36    # aplha channel correction is the winner
37    # also rescale the image without interpolation so that, when displayed as favicon etc., it is not as smoothed out - we want to show real output
38    skimage.io.imsave(os.path.join(basedir,names[idx]),zoom(flowi_3,(3,)*(flowi.ndim-1)+(1,),order=0))
39
avarage bias is [0.062608756, 0.06555136], average angle is 0.25730722792217886 pi rad.

avarage bias is [0.061921515, 0.06161317], average angle is 0.24920548520168206 pi rad.
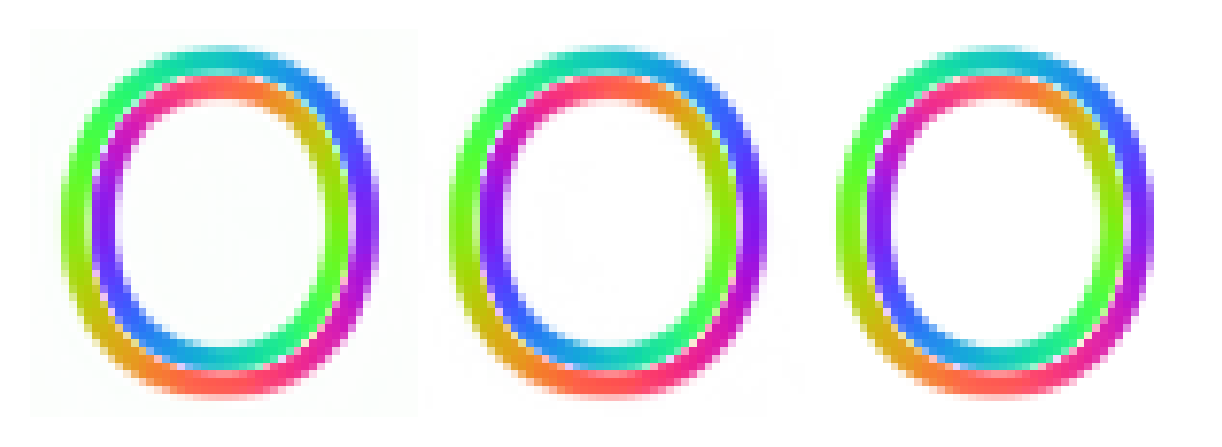
Turns out that subtracting off the flow component bias introduces some over-correction in places, leading to some discoloration. So, alpha adjustment it is. It might be hard for you to see it, but I can. This level of pixel-peeping is how I made my ground-truth data ;-)
Exporting
Favicons need to be a particular resolution. For now I am making a multi-scale .ico, but that isn't working properly on Safari (too pixelated). Seems like multiple separate PNGs is the way to go moving forward.
 1from PIL import Image
 2filename = os.path.join(basedir,names[-1])
 3zimgs = []
 4
 5for j,sz in enumerate([(32,32), (128,128), (180,180), (192,192)]):
 6    scale = np.array(sz)/np.array(flowi_3.shape[0:2])
 7    zimg = zoom(flowi_3,tuple(scale)+(1,),order=(np.max(scale)<1))
 8    zimgs.append(zimg)
 9    # plt.imshow(zimg)
10    # plt.axis('off')
11    # plt.show()
12    # zimg.shape
13
14icon = Image.fromarray(zimgs[0], 'RGBA')
15icon.save(filename,append_images=[Image.fromarray(z, 'RGBA') for z in zimgs[1:]])